Permutation Tests as Statistical Significance Tests in Model Comparison: A Practical Guide
In the context of working with data analysis or machine learning, it's often essential to determine whether one model significantly outperforms another on a given dataset. Statistical significance tests can provide a robust way to make this comparison.
Permutation tests are a non-parametric method to test the null hypothesis that two models have similar performances. This article explains the concept of permutation tests and provides a Python code snippet to implement the test. We'll also explore an example using a small dataset to compare two classifiers.
Permutation Tests: An Overview
A permutation test is a type of resampling technique used to assess the significance of an observed effect. In the context of comparing two machine learning models, the test's goal is to understand whether the difference in performance metrics between the models is statistically significant.
Steps in Permutation Testing
- Calculate the Observed Difference: Compute the difference in performance metric (e.g., accuracy) between the two models on the original data. (See Figure 1)
- Permute the Labels: Randomly shuffle the predictions of the two models.
- Recompute the Difference: Calculate the difference in performance metric using the permuted predictions. (See Figure 2)
- Repeat: Repeat steps 2 and 3 many times to build a distribution of differences under the null hypothesis.
- Calculate the P-value: Determine the proportion of permuted differences that are at least as extreme as the observed difference.
A low p-value (e.g., < 0.05) indicates that the observed difference in performance is unlikely to have occurred by random chance, signifying a significant difference between the models.
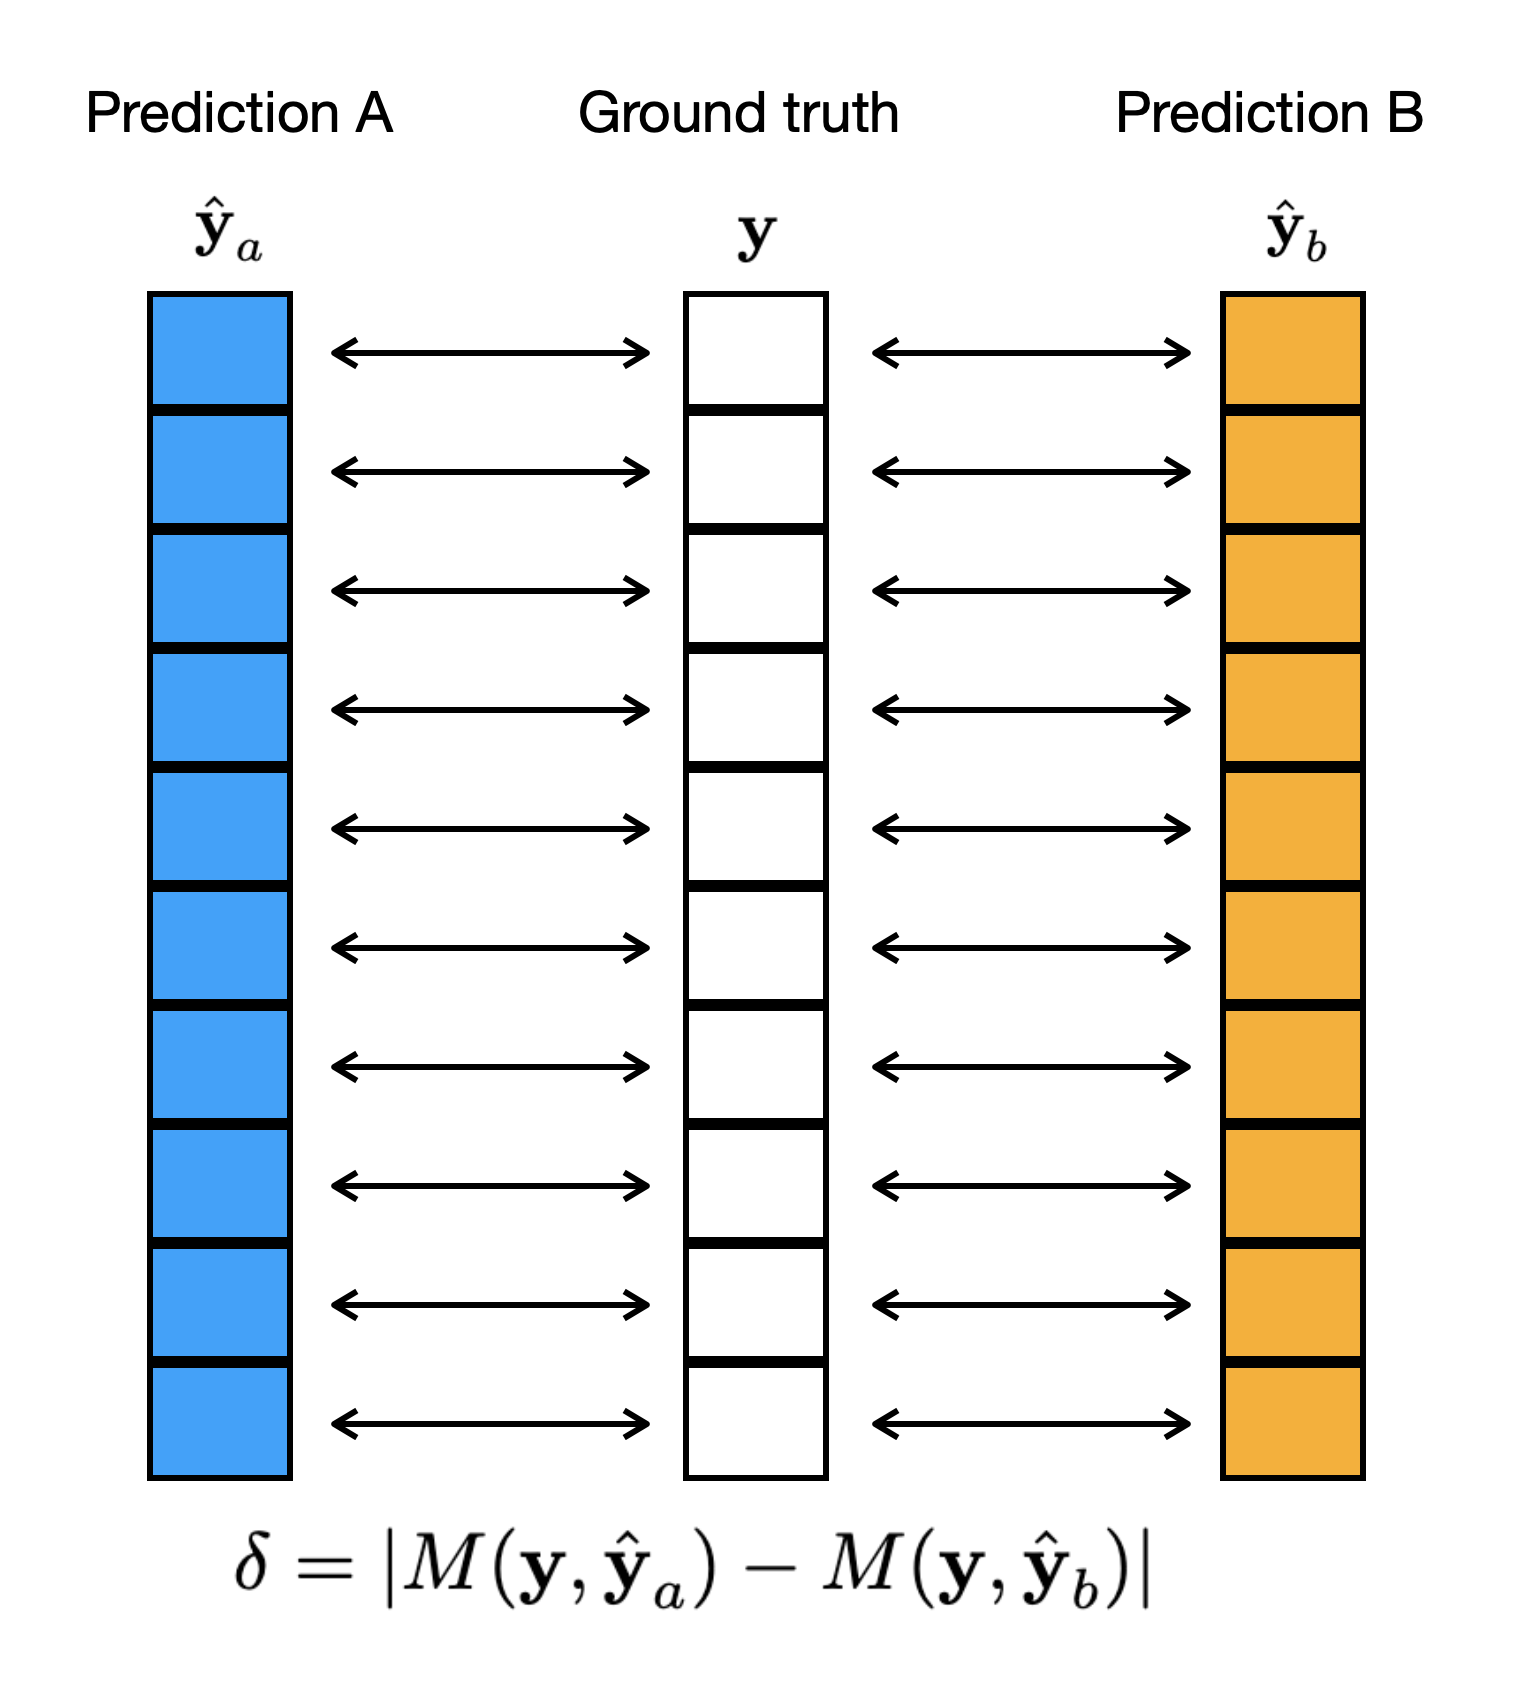
Figure 1: The original alignment of the examples when computing a metric M.
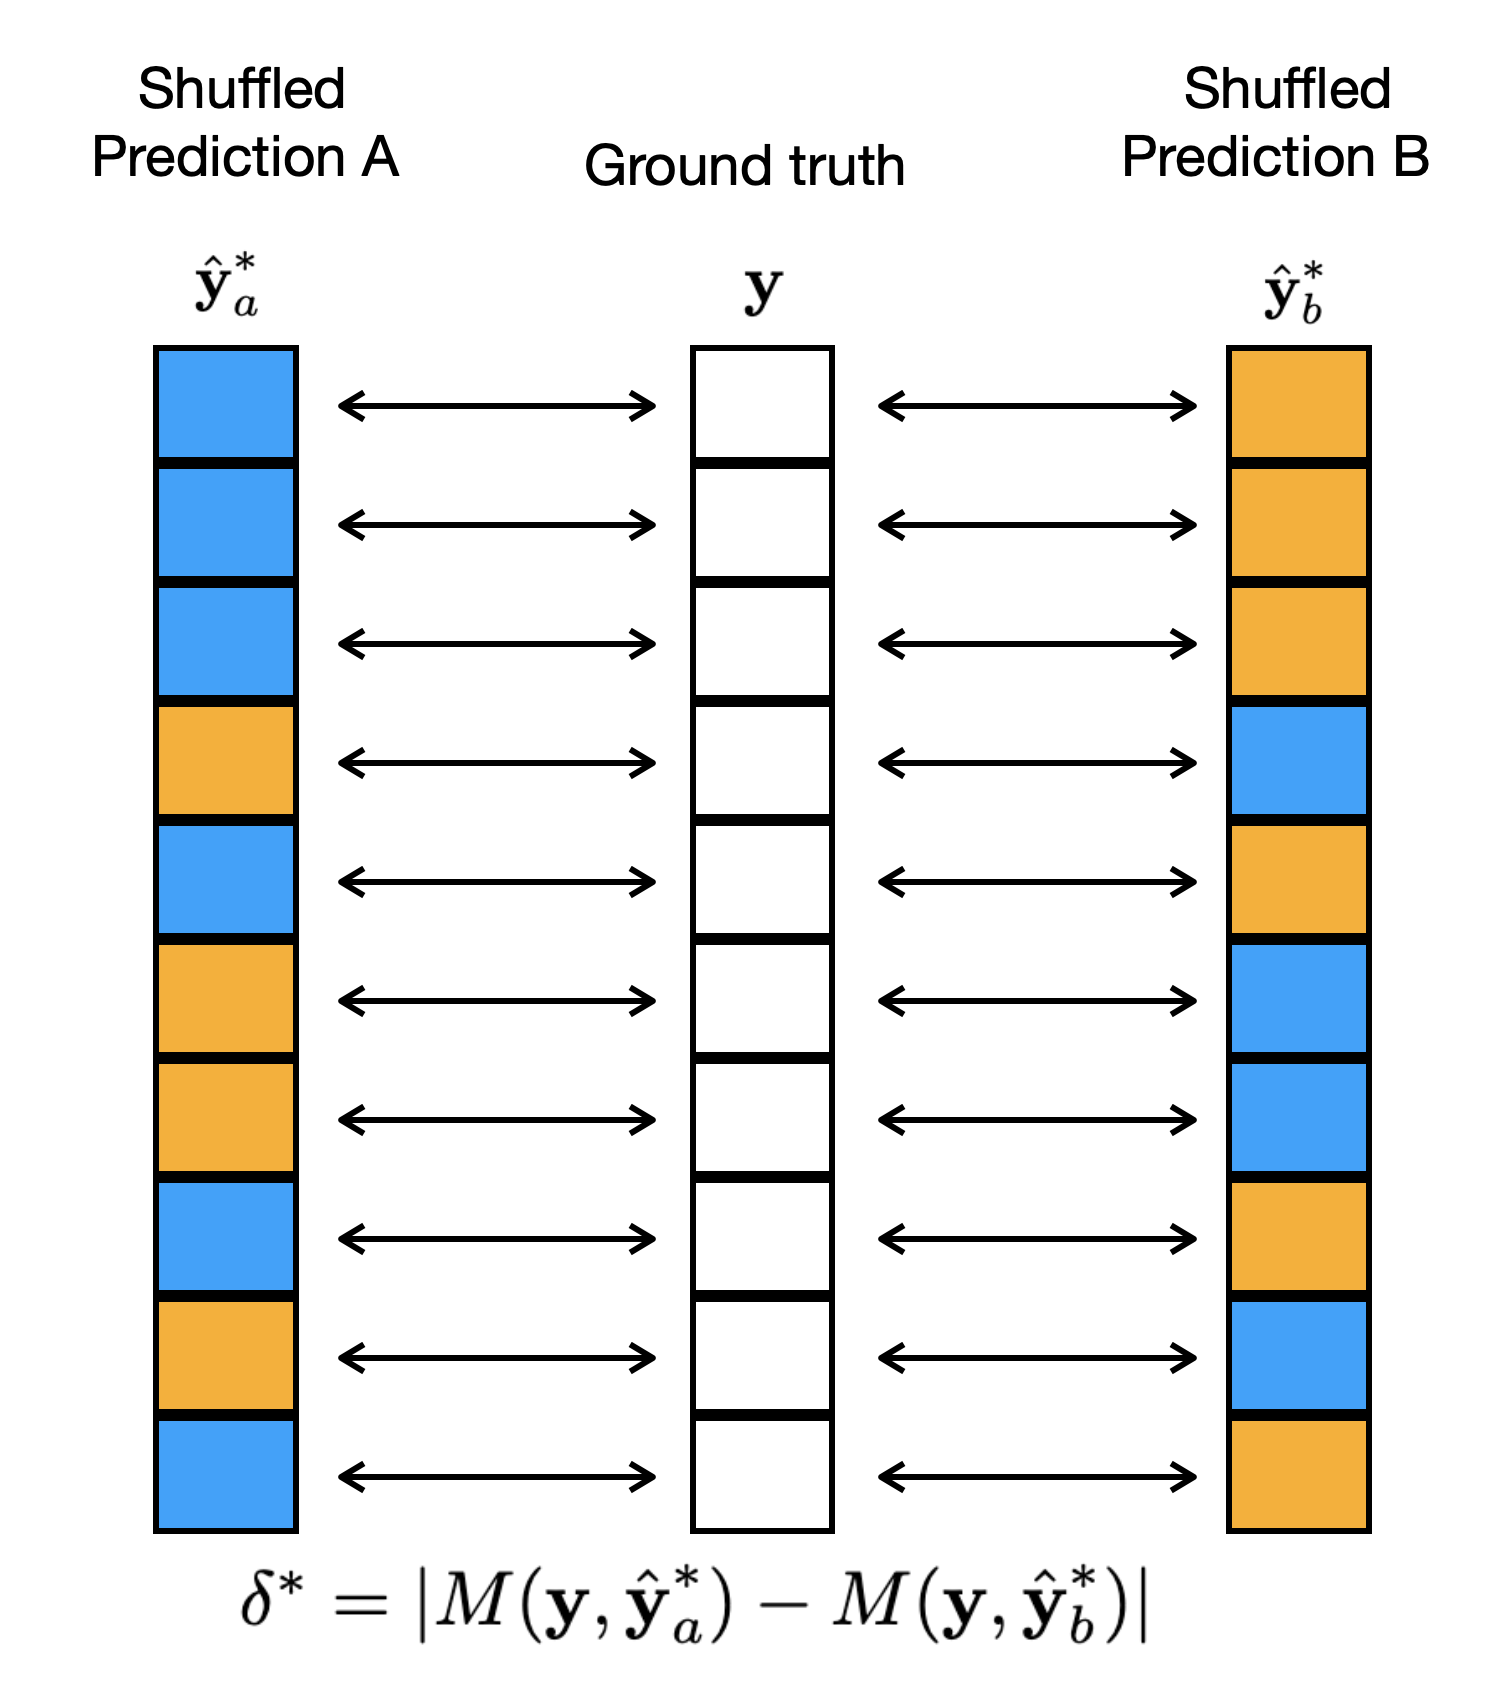
Figure 2: An example of a shuffled alignment of the examples when computing a metric M.
This test has the following advantages:
1. It can be calculated for arbitrary metrics, in a paired fashion too. This can be used with AUC score for example.
1. It does not need to assume a normal distribution around the metrics.
1. It is easy to apply.
Python Implementation
Below is the Python code to perform a permutation test for comparing two sets of predictions:
import numpy as np


def significance_test(metric_fn, y_true, y_pred_a, y_pred_b, tries=4096, random_state=41):
    assert y_true.shape[0] == y_pred_a.shape[0] == y_pred_b.shape[0]

    metric_a = metric_fn(y_true, y_pred_a)
    metric_b = metric_fn(y_true, y_pred_b)
    benchmark = np.abs(metric_a - metric_b)  # observed difference

    if random_state is not None:
        np.random.seed(random_state)  # fixing seed for reproducability
    samples = np.zeros(tries)  # the distribution of differences
    for i in range(tries):
        msk = np.random.random(size=y_true.shape[0]) < 0.5

        y_pred_a_perm = y_pred_a.copy()
        y_pred_b_perm = y_pred_b.copy()

        y_pred_a_perm[msk] = y_pred_b[msk]
        y_pred_b_perm[msk] = y_pred_a[msk]

        samples[i] = np.abs(
            metric_fn(y_true, y_pred_a_perm) - metric_fn(y_true, y_pred_b_perm)
        )
    pvalue = 1 - np.mean(benchmark > samples)

    return metric_a, metric_b, pvalue, benchmark, samples.mean(), samples.std()
metric_fn: A function to compute the performance metric (e.g., accuracy).y_true: The true target values.y_pred_aandy_pred_b: Predictions from two different models.tries: Number of permutations to perform.random_state: Seed for reproducibility.
The function returns the metrics for both models, the p-value, and other statistical information.
Example: Comparing Classifiers on the Breast Cancer Dataset
Let's see how to use this function with a small machine learning task. We'll compare two classifiers on the breast cancer dataset.
from sklearn.datasets import load_breast_cancer
from sklearn.linear_model import LogisticRegression
from sklearn.svm import SVC
from sklearn.metrics import accuracy_score
from sklearn.model_selection import train_test_split
from scipy.stats import ttest_ind

# Load the Breast Cancer dataset
data = load_breast_cancer()
X_train, X_test, y_train, y_test = train_test_split(
    data.data, data.target, test_size=0.4, random_state=42
)

# Try different hyperparameters to demonstrate the test
for C in [1.0, 0.5, 0.1, 0.05]:
    # Train two classifiers
    model_a = LogisticRegression(max_iter=10000)
    model_b = SVC(C=C, probability=True)
    model_a.fit(X_train, y_train)
    model_b.fit(X_train, y_train)

    # Make predictions
    y_pred_a = model_a.predict(X_test)
    y_pred_b = model_b.predict(X_test)
    y_pred_prob_a = model_a.predict_proba(X_test)[:, 1]
    y_pred_prob_b = model_b.predict_proba(X_test)[:, 1]

    # Perform significance test
    metric_a, metric_b, pvalue, diff, diff_mean, diff_std = significance_test(
        accuracy_score, y_test, y_pred_a, y_pred_b
    )
    metric_a, metric_b, diff, diff_mean, diff_std = (np.array([
        metric_a, metric_b, diff, diff_mean, diff_std
    ]) * 100).tolist()

    print(f"Accuracy of Model LR: {metric_a:.1f} %,"
          f" SVM-(C={C:.2f}): {metric_b:.1f} %")
    print(f"P-value: {pvalue:.6f}")
    print(f"Observed difference: {diff:.2f} %")
    print(f"Expected differences with 0,1,2,3 stds: {diff_mean:.2f}% "
          f"{diff_mean+diff_std:.2f}% {diff_mean+diff_std*2:.2f}%"
          f" {diff_mean+diff_std*3:.2f}%")
    print('================================================')
Gives the following output:
Accuracy of Model LR: 96.9 %, SVM-(C=1.00): 94.3 %
P-value: 0.209229
Observed difference: 2.63 %
Expected differences with 0,1,2,3 stds: 1.37% 2.46% 3.55% 4.64%
================================================
Accuracy of Model LR: 96.9 %, SVM-(C=0.50): 93.4 %
P-value: 0.097900
Observed difference: 3.51 %
Expected differences with 0,1,2,3 stds: 1.46% 2.60% 3.75% 4.89%
================================================
Accuracy of Model LR: 96.9 %, SVM-(C=0.10): 91.7 %
P-value: 0.015625
Observed difference: 5.26 %
Expected differences with 0,1,2,3 stds: 1.62% 2.87% 4.13% 5.38%
================================================
Accuracy of Model LR: 96.9 %, SVM-(C=0.05): 89.0 %
P-value: 0.000488
Observed difference: 7.89 %
Expected differences with 0,1,2,3 stds: 1.84% 3.23% 4.63% 6.02%
================================================
The provided output demonstrates a comparison between a Logistic Regression model and an SVM model with varying degrees of regularization. As the regularization strength in the SVM model increases (i.e., the (C) value decreases), its performance deteriorates. The p-values from the statistical tests reflect this trend: (i) A high p-value indicates no significant difference between the models. (ii) As the SVM model's performance worsens, the p-values decrease, revealing a statistically significant difference.
Additionally, the observed difference is reported, while also reporting the distribution of differences by the permutation test. It can be observed that low p-values correspond to the number of standard deviations the observed difference deviates from the mean of differences. In the example where C=1.00, the p-value is 20.9%, which shows that the observed difference 2.63% is more extreme than nearly 79% of the data, which is between 1 and 2 standard deviations away from the mean difference of 1.37 %. In the most extreme example with C=0.05, we observe that the p-value is nearly 0, which indicates that the observed difference 7.89% is much more extreme than the vast majority of the distribution, hence very unlikely to occur, it is farer than 3 standard deviations away from the mean different 1.84%.
In summary, permutation tests offer a flexible and robust way to compare the performances of different machine learning models. By resampling predictions and calculating the p-value, we can determine whether the observed differences are statistically significant. The provided code snippet and example provide a practical tool to implement this powerful statistical technique in your machine learning projects.
Created Mar 2023 — Updated Oct 2024